How we fixed a Node.js memory leak by using ShadowReader to replay production traffic into QA
Introduction
At Edmunds, we recently moved our front end stack to a monolithic, isomorphic application based on Node.js, Express, and React. In the past, we relied on Java applications using a microservices architecture. While the migration to JavaScript based technology has given us many benefits, we are still battle testing it.
A problem we faced recently was a memory leak in our Node.js application. It confounded our engineering team as it was only occurring in our production environment; we could not reproduce it in QA, until we introduced a new type of load testing tool developed here at Edmunds, which replays production traffic.
The Problem
On Christmas Eve, 2017, we suffered an incident in which there was a jump in response time across the board and error rates tripled, impacting many users of our website.
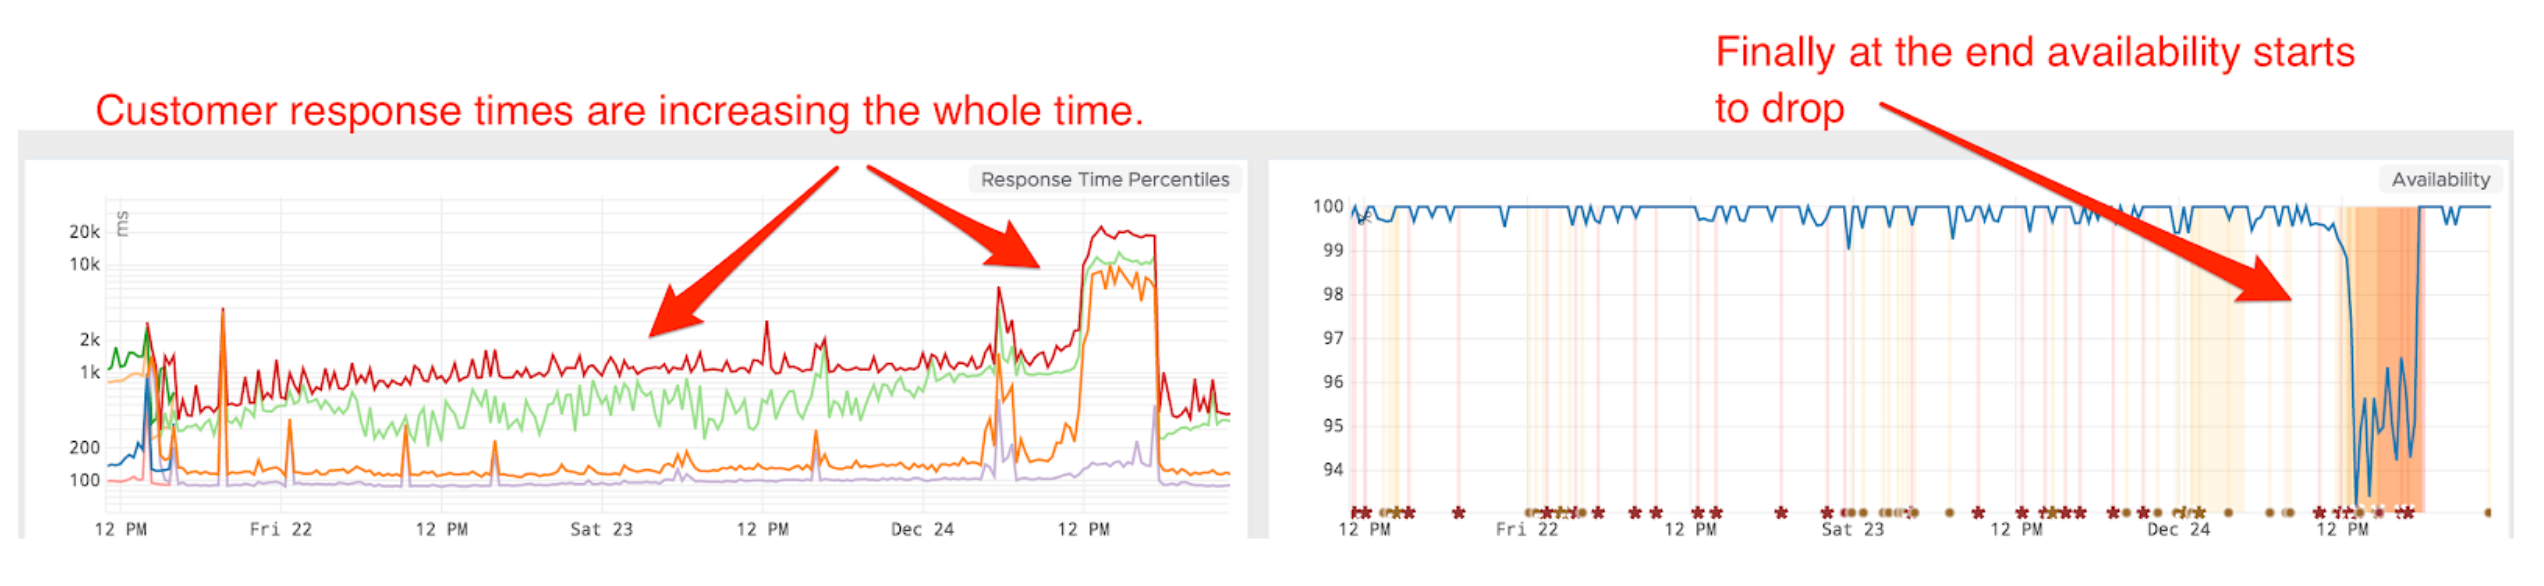
During this incident, monitoring helped identify and resolve the issue quickly, but we still needed to understand the root cause.
At Edmunds, we leverage a robust continuous delivery (CD) pipeline that releases new updates to production multiple times a day. We also dynamically scale up our applications to accommodate peak traffic and scale down in after hours to save costs. Unfortunately, this had the side effect of masking a memory leak.
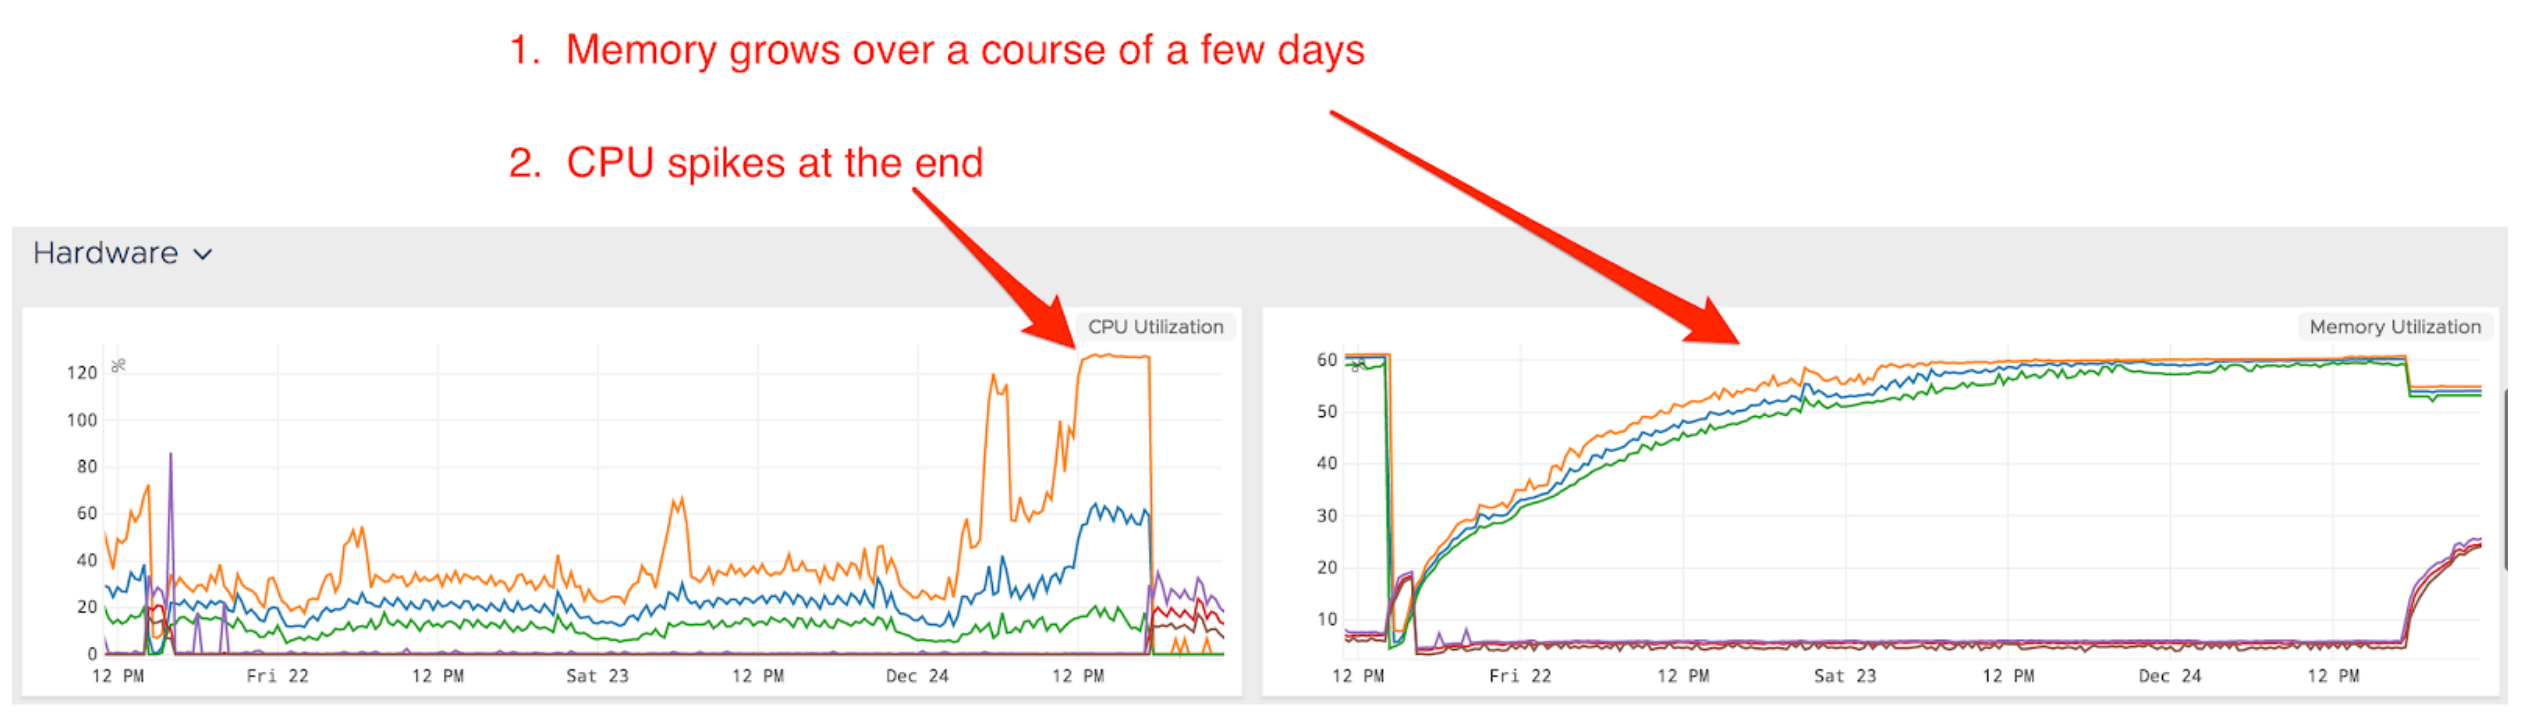
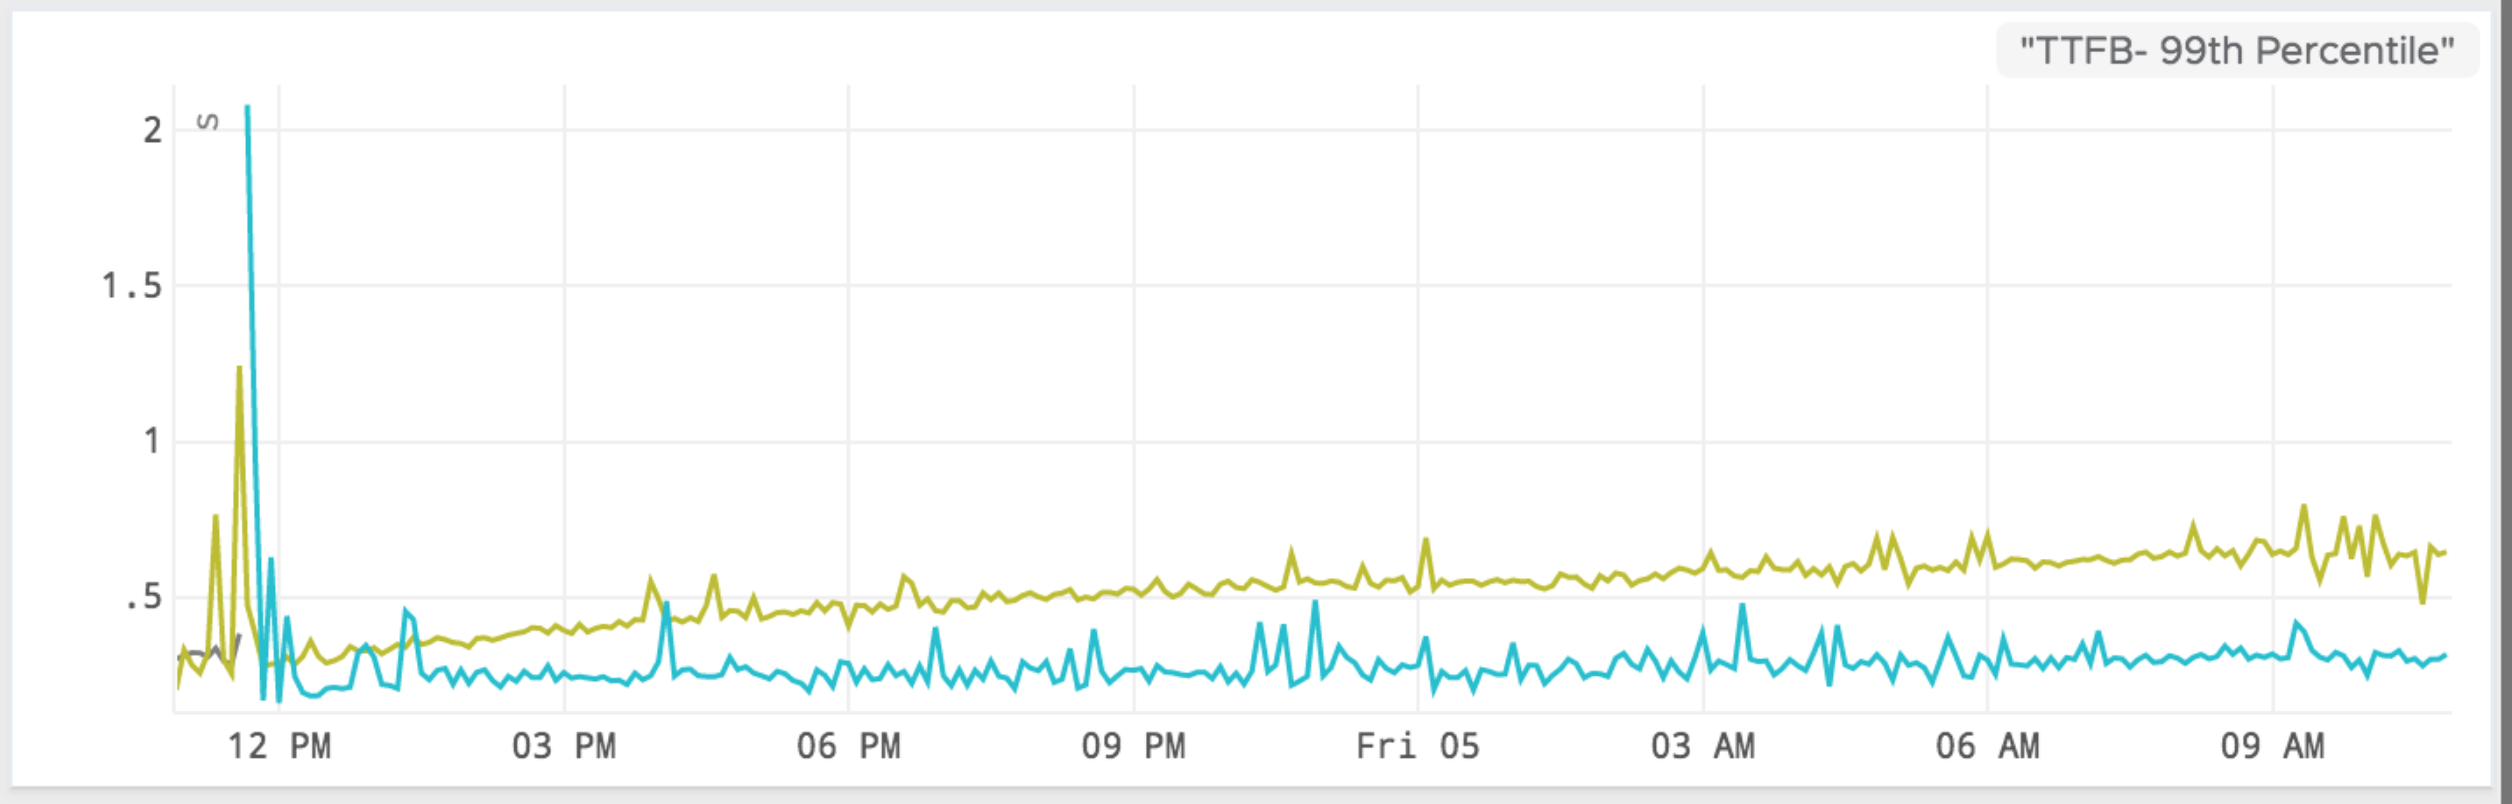
In early December we first noticed a monotonous increase in memory usage of our Node.js application. The memory usage would climb to 60%, along with a slow increase in 99th percentile response time.
However, between our CD pipeline and autoscaling events, long-running containers were frequently getting shut down and replaced by newer ones. This inadvertently masked the memory leak until we collectively decided to stop releasing software to ensure stability during the holidays.
Edmunds CD Pipeline
At a glance, our CD pipeline looks like this:
- Unit test
- Build Docker image for the application
- Integration test
- Load test / performance test
- Canary release
The solution is fully automated, and requires no manual cutover. The final step is a canary deploy directly into the live website, allowing us to release multiple times a day.
For our load testing, we leveraged custom tooling built on top of JMeter. It takes random samples of production URLs and can simulate various percentages of traffic. Unfortunately, however, our load tests were not able to reproduce the memory leak in any of our pre-production environments.
Solution to the memory leak
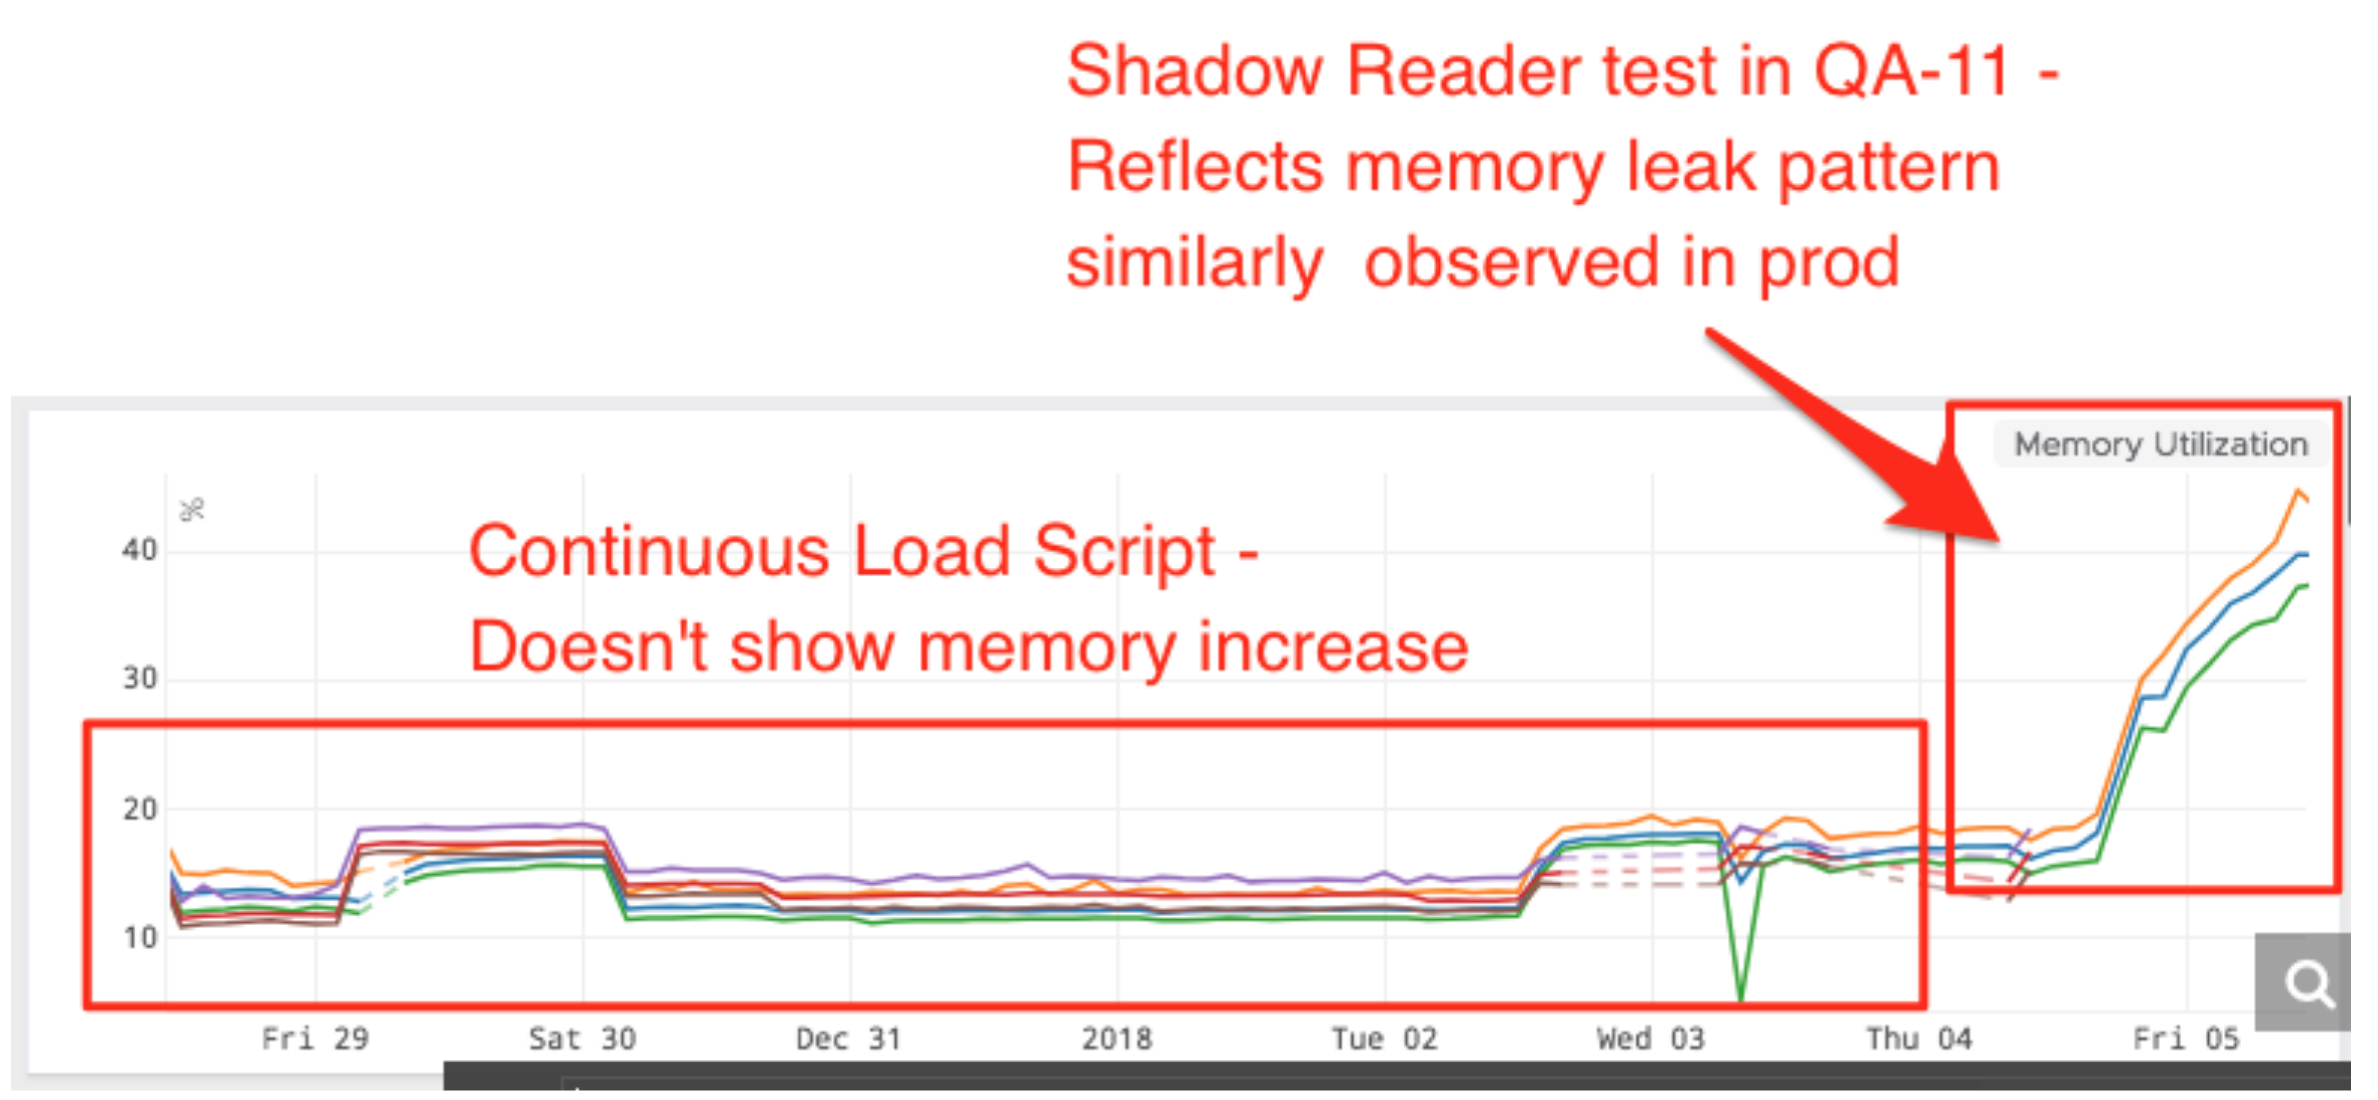
When looking at the memory patterns in QA we noticed that there was a very healthy pattern. Our initial hypothesis was that our JMeter load testing in QA was not able to simulate prod traffic in a way that we can predict how our applications will perform.
While the load test samples from production urls, it is not able to precisely simulate the urls customers used and the exact frequency of calls (burst rate).
Our first step was to recreate the problem in QA, and we used a new tool called ShadowReader to do this. ShadowReader is a project that evolved out of one of our hackathons. While many projects were product focused, of the winners, this was the only operations-centric one. It is a load testing tool that runs on AWS Lambda and can replay production traffic and usage patterns against our QA environment.
The results returned were immediate:
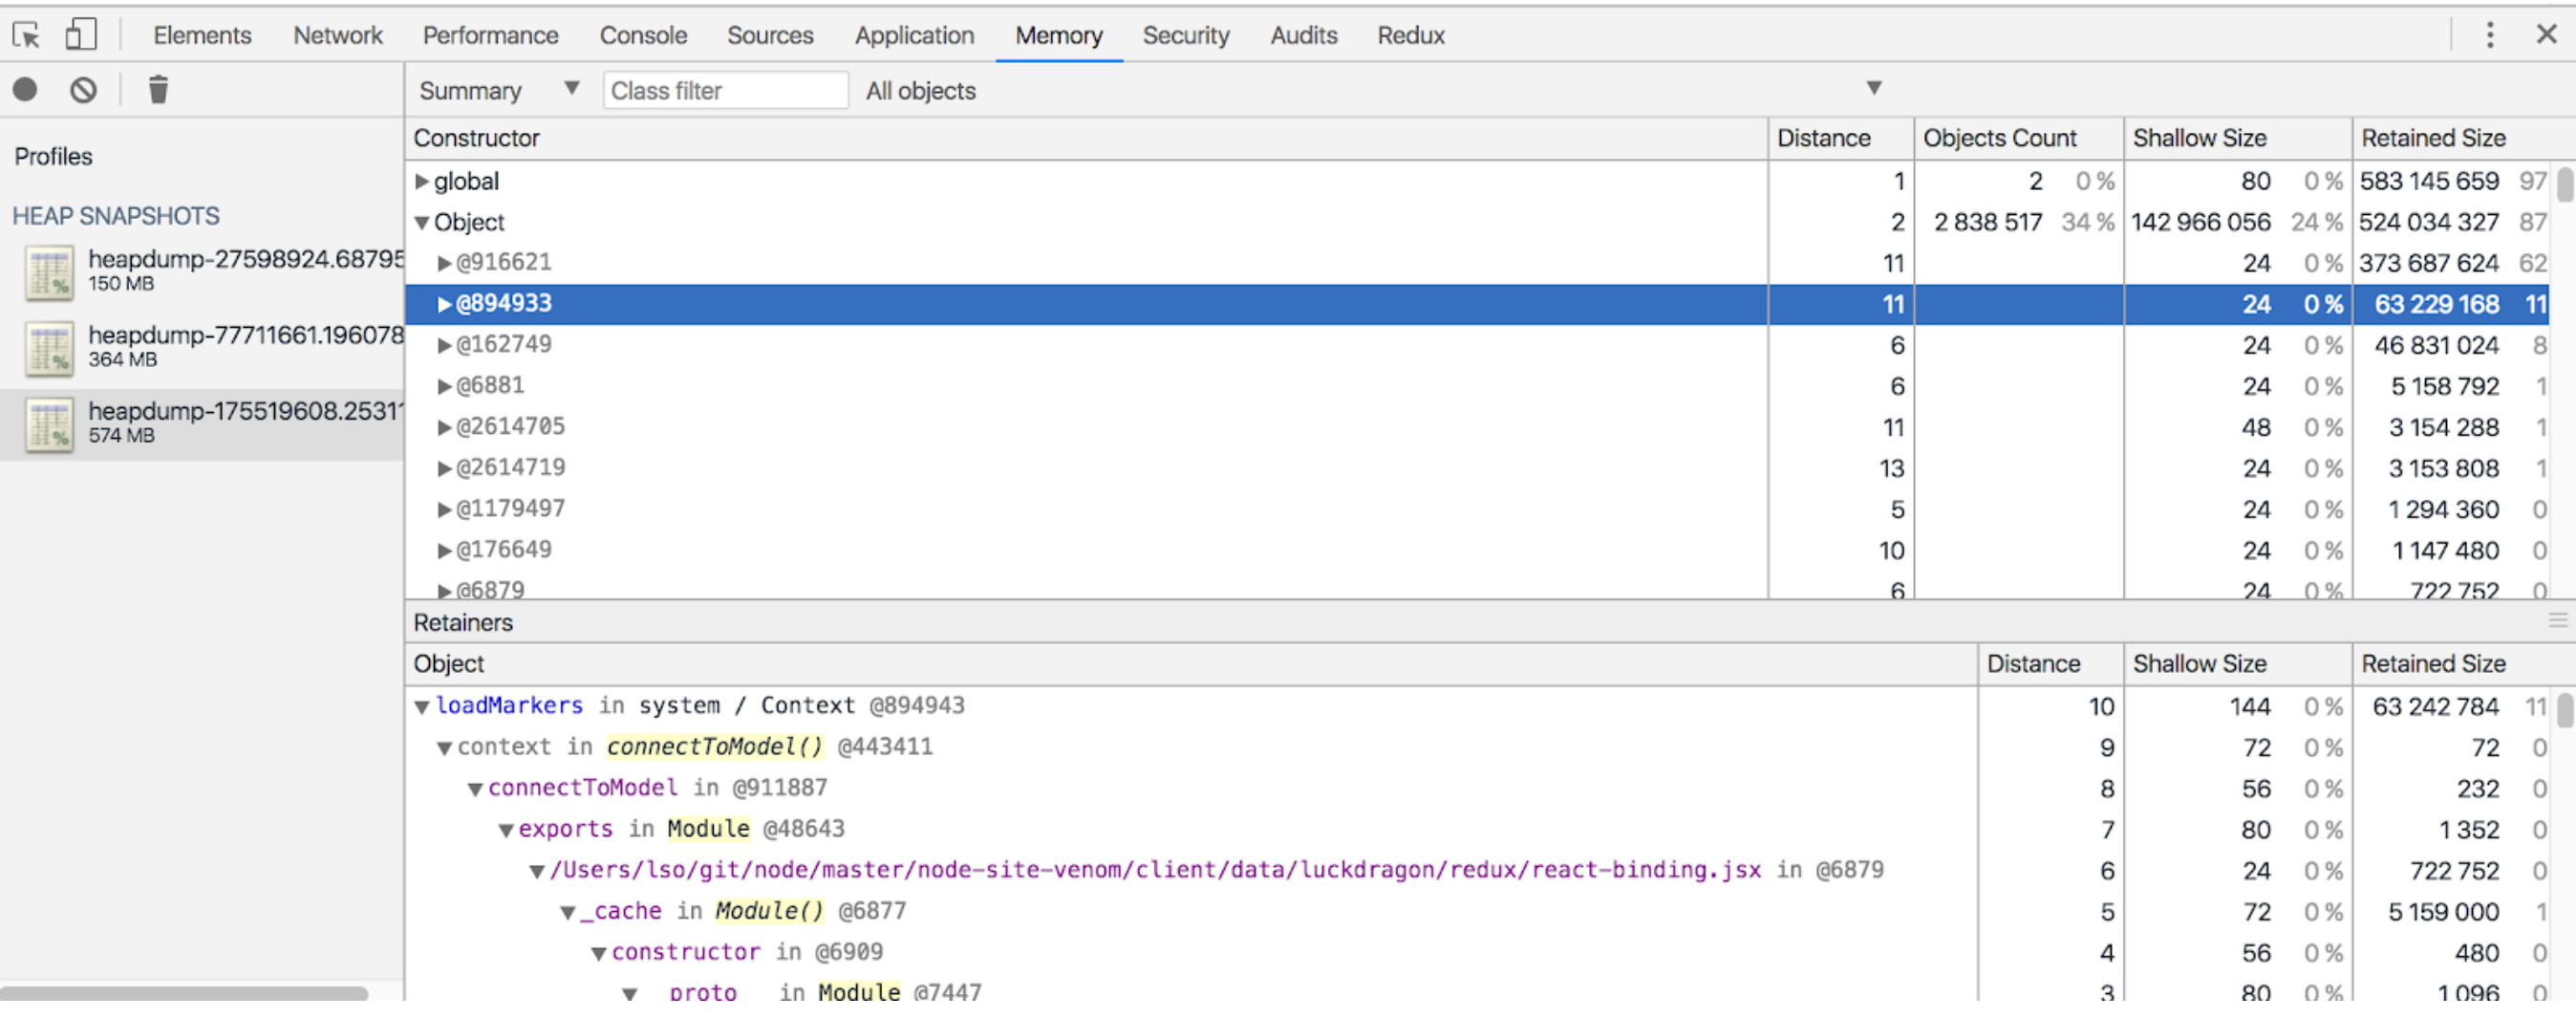
Knowing that we could recreate the problem in QA, we took the additional step to point ShadowReader to our local environment, this allowed us to trigger Node.js heap dumps. After analyzing the contents of the dumps it was obvious that the memory leak was coming from two excessively large objects containing strings. At the time the snapshot was dumped these objects contained 373MB and 63MB of strings!
It was determined that the objects were both temporary lookup caches containing metadata to be used on the client side. Neither of these caches were ever intended to be persisted on the server side. The user’s browser would only cache a small fraction of this metadata, but on the server side it was caching for all users. This is why we were unable to reproduce the leak with synthetic testing. Synthetic tests always resulted in the same fixed set of metadata in the server side caches. The leak only surfaced when we had a sufficient amount of unique metadata being generated from a variety of users.
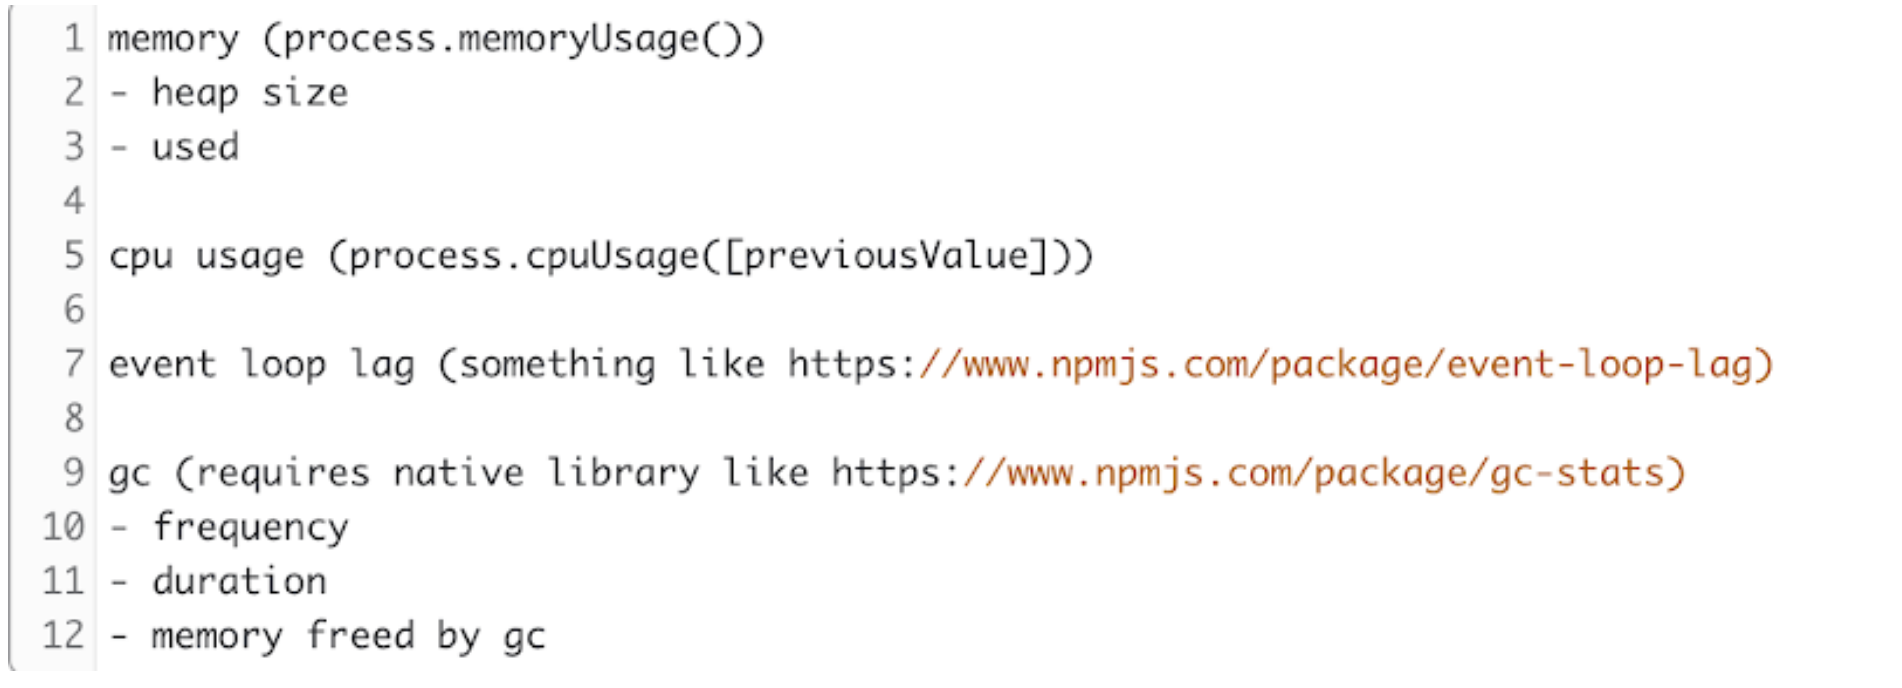
Once we identified the problem, we were able to remove the large caches that we observed in the heap dumps. We’ve since instrumented the application to start collecting metrics that can help detect issues like this faster.
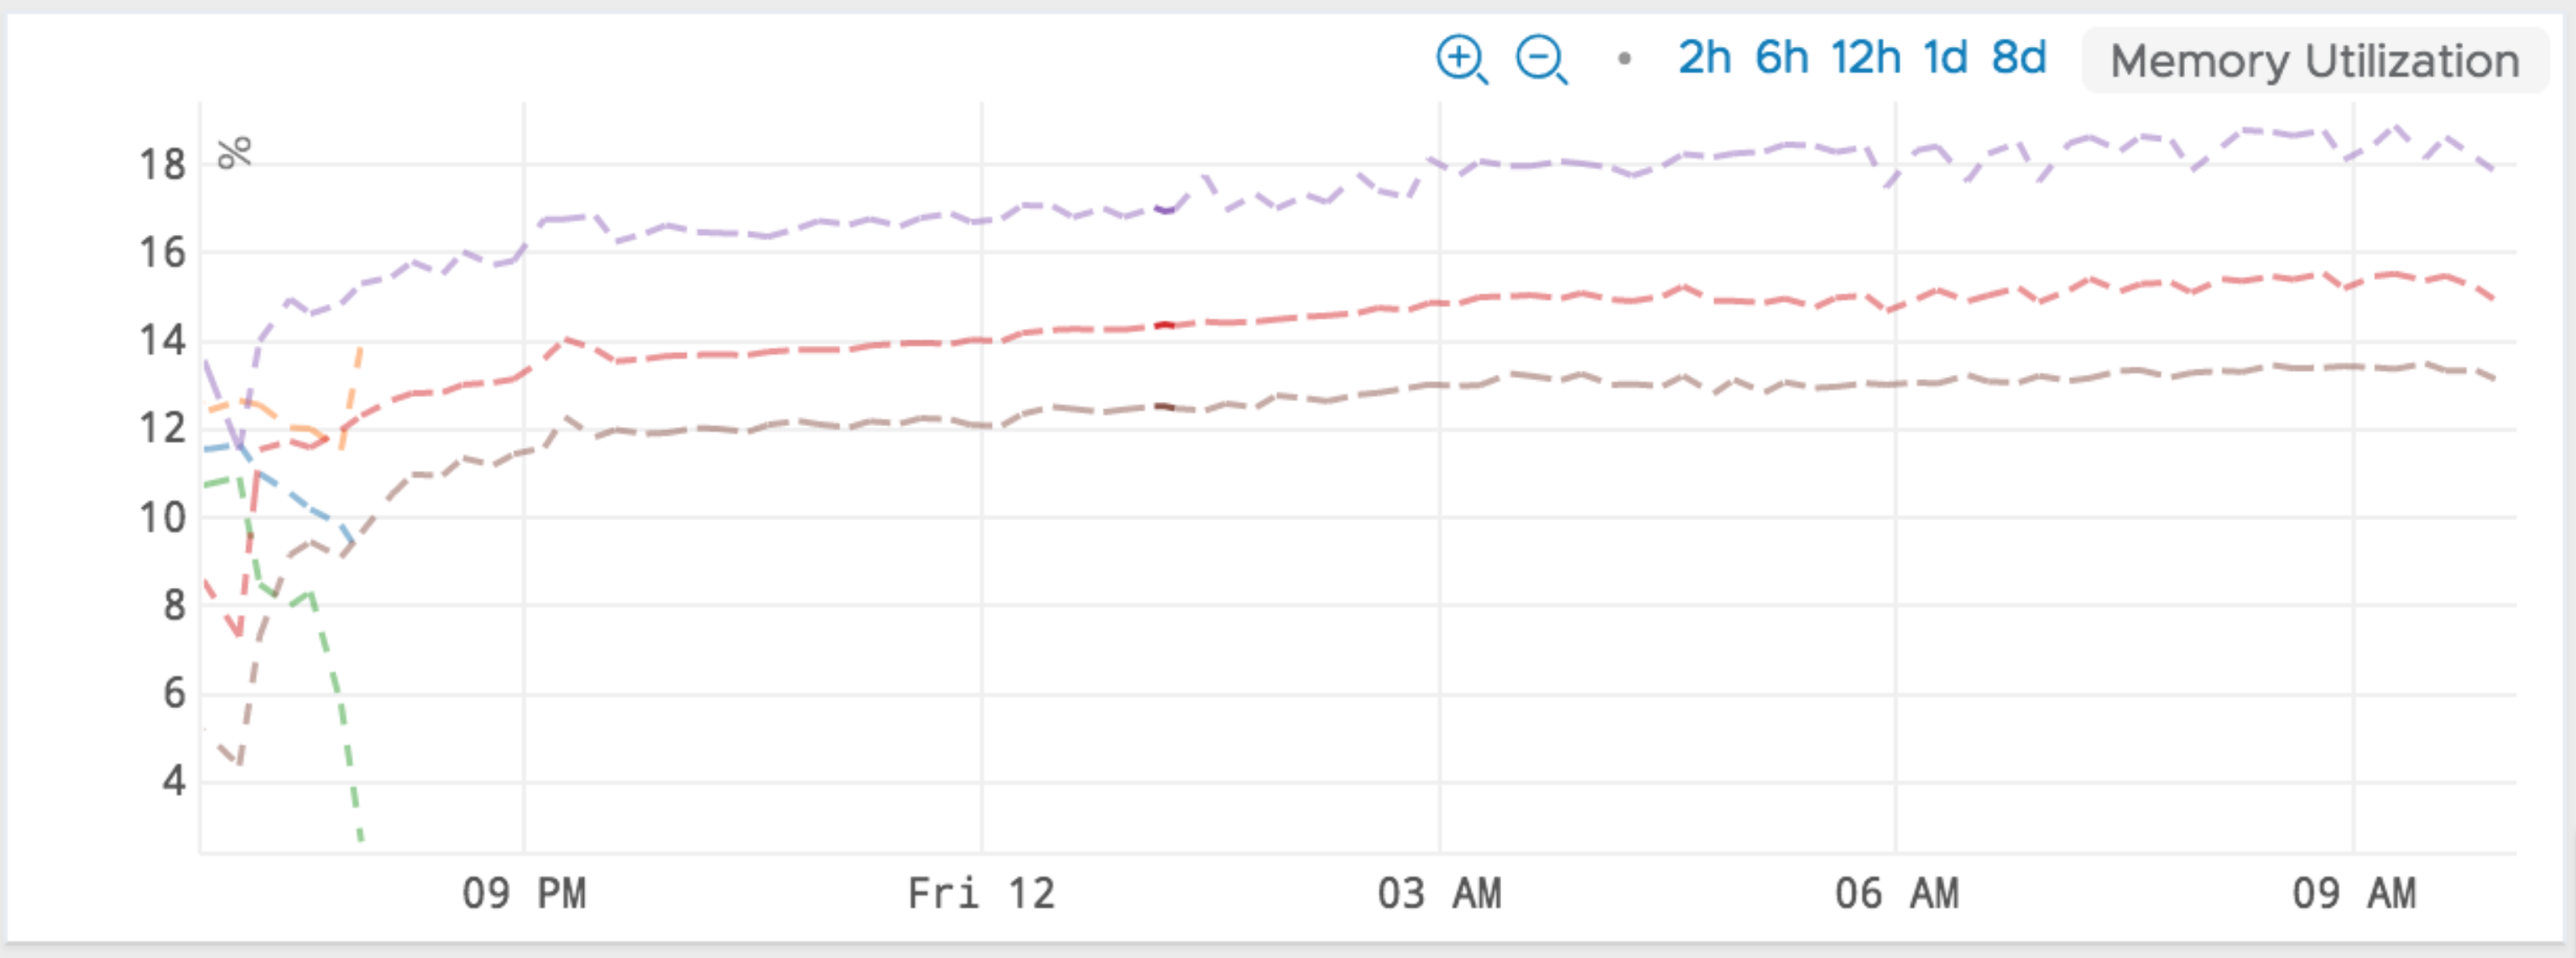
 Lastly, after making the fix in QA, we saw that the memory usage was constant and the leak was plugged.
Introducing ShadowReader
![]()
ShadowReader is a serverless load testing framework that leverages AWS Lambda and S3 to replay production traffic to testing environments. It mimics real user traffic by replaying URLs from production at the same rate as the live website. We are happy to announce that after months of internal usage, it is now open source!
Features
- ShadowReader mimics real user traffic by replaying user requests (URLs). It can also replay certain headers such as True-Client-IP and User-Agent along with the URL.
- It is more efficient cost and performance wise compared to traditional distributed load tests that would run on a fleet of servers.
- We’ve scaled this up to 50,000 requests/min, but it should be able handle more than 100,000 reqs/min.
- New load tests can be spun up instantly and stopped instantly.
-
It has the ability to ramp traffic up or down by a percentage value, so that it can function as a more traditional load test.
- Plugin system: Switch out plugins to change the behavior of ShadowReader. For instance, you can switch from past replay (replay past requests) to live replay (replay requests as they come in)
- Currently, it can replay logs from these Elastic Load Balancers:
- Application Load Balancer
- Classic Load Balancer
- (Support for other types of load balancers planned)
How it works
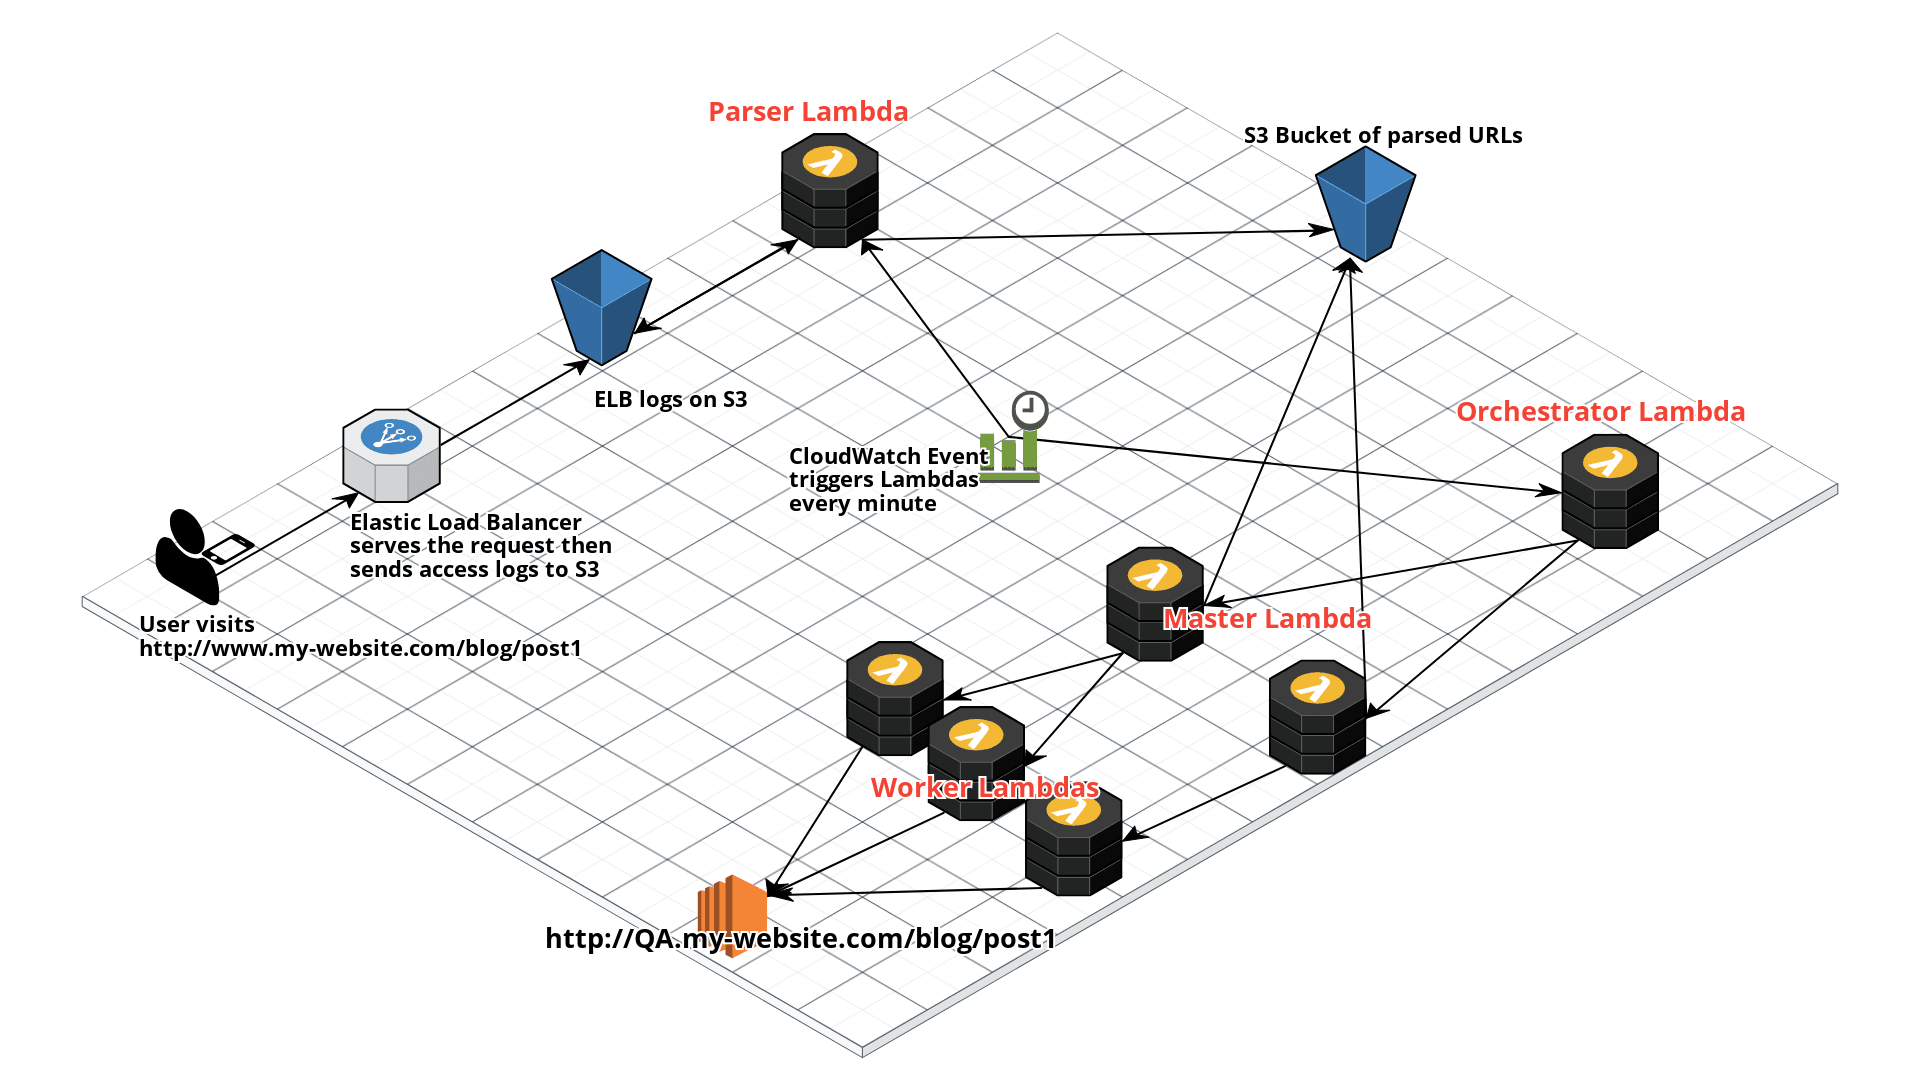
ShadowReader is composed of four different Lambdas: a parser, an orchestrator, a master, and a worker.
When a user visits a website, (typically) a load balancer (in this case, an ELB) will route the request. As the ELB routes the request, it will log this event and ship it to S3.
Next, ShadowReader will trigger a Parser Lambda every minute via a CloudWatch event and will parse the latest access (ELB) logs on S3 for that minute, then ship the parsed URLs into another S3 bucket.
On the other side of the system, an Orchestrator lambda is also triggered every minute. This Lambda holds the configurations and state of the system.
The Orchestrator will then invoke a Master Lambda function. From the Orchestrator, the Master will receive information on which time slice to replay and download the respective data from the S3 bucket of parsed URLs (deposited there by the Parser).
The Master Lambda will first divide the load test URLs into smaller batches, then invoke and pass each batch into a Worker Lambda. If say, 800 requests must be sent out, then eight Worker Lambdas will be invoked, each one handling 100 URLs.
Finally, the Worker will receive the URLs passed from the Master and start load testing the chosen test environment.
Getting started
If you would like to test drive ShadowReader, check out the GitHub Repo: https://github.com/edmunds/shadowreader
The README will go over how to deploy and configure ShadowReader to start load testing your website.
We would love to hear what you think and welcome contributions. See the contributing guide to get started!
Current limitations that could be improved upon:
- Plugins for parsing other types of access logs
- Easier configuration and set-up
- Better monitoring of load test results (currently handled through CloudWatch)
Edit: 16 October 2018 This article was edited to reflect recent changes to nomenclature within ShadowReader.
 Sharath Gowda is Executive Director of Site Reliability Engineering at Edmunds.
 Yuki Sawa is a Software Engineer in the Cloud Infrastructure team at Edmunds.
 Joey Davis is Technical Lead of the Platform team at Edmunds.