Using Sceneform to Develop Can It Fit? For Android (Part 2)
Introduction
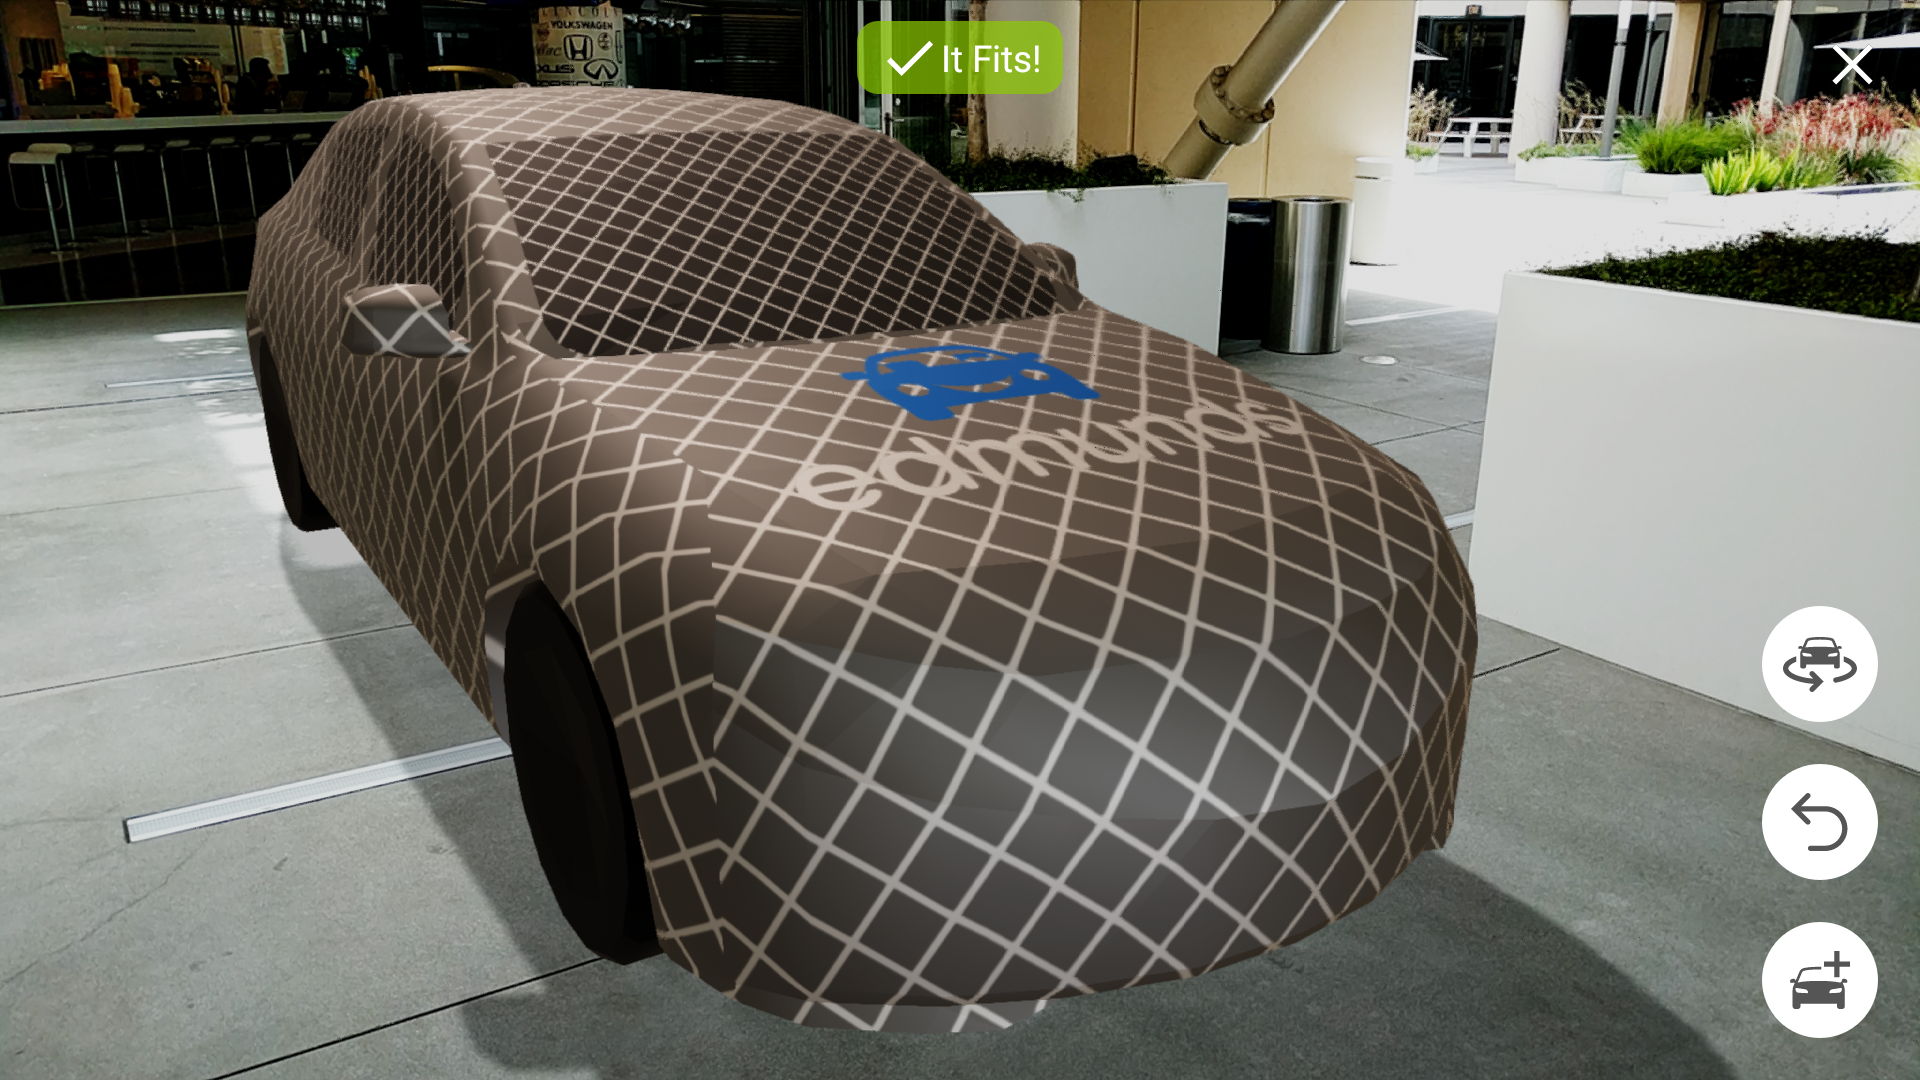
In Part 1, we introduced Can It Fit?, an Augmented Reality experience for Edmunds mobile applications. We also discussed how we approached development of the Android version and app architecture. This article will focus on how using Sceneform, Google’s library for developing ARCore applications, helped us handle rendering concerns of the application.
Triangles as Primitives
3D objects are typically composed of triangles, which are also referred to as “polygons” or “faces”. OpenGl ES, a graphics API on Android, treats them as a primitive type. Every triangle can be represented as a set of geometric vertices in 3-dimensional space that are connected by line segments. For example, we can describe a triangle by a set of three vertices: A, B, and C. We can then connect those vertices by line segments a, b, and c to form the shape. Every pixel that falls within the boundaries of the triangle can be shaded into a color. In the image below, every vertex is represented by three coordinates where the third coordinate is depth. We set it to 0 here for simplicity. Typically, it would be represented by the z-axis that points either away or towards you (depending on the convention of the graphics API)

Rendering
As previously stated, 3D objects are composed of triangles, which can be described as a set of vertices that are connected by line segments in a specific order. In order to tell the GPU that we want to render a triangle, we need to “speak” to it through a graphics API, which represents a set of commands (method calls) describing what we want to draw. We also need to pass the data that describes the object being drawn. This data contains two arrays: one representing the order in which the vertices are connected and the other representing a list of the vertices themselves.

Note that the vertices array has 9 elements. This is due to the fact that we have three elements per vertex – x, y, and z coordinates in 3D space, which is referred to as position component or attribute of the vertex. However, each vertex can pack more information than just space coordinates. It can also have components such as texture coordinates, normals, and other. But how would the GPU know how to make sense of that data? There are OpenGL ES calls that require us to provide such information to the GPU. We just pass in the information such as stride (the byte offset between consecutive vertex attributes), type (data type of each component), size (the number of components per vertex attribute).
As stated above, indices tells the GPU in which order to “connect the dots”. Each entry in indices must correspond to a vertex in vertices array. As with most index values in computer science, vertex indices start with 0. This particular example tells the GPU to connect A to B, B to C, and C to A.
Imagine an object that’s composed of thousands of triangles. The developer is responsible for maintaining data structures to organize the data. Sceneform provides a rendering library that abstracts away the data into meaningful structures and relieves the developer from having to deal with graphics API calls directly. We took advantage of the helper function makeCube from ShapeFactory class to help us create box Renderable object, which encapsulates data such as vertices, material (coloring information), collision shape, and other data that is helpful to the rendering engine.
Object Transformations
But wait, there’s more! 3D objects are often animated – they can move, change direction, “grow” or “shrink” in size. Those transformations are achieved by translating, rotating, and scaling object’s vertices by applying mathematical operations to each vertex. To be able to perform such transformations, we had to build a math library that supports vectors, matrices, vector addition/subtraction as well as matrix multiplication. One massive benefit of switching to Sceneform was that it provided us a math library out of the box, which supports Quaternions (a mathematical notation for representing orientations and rotations of objects in three dimensional space) and its operations. This made development much easier.
Scene Graph
Another consideration when building 3D scenes is orchestration of all of its objects. Each object may have its own transformation parameters or it may share them with other objects. Typically, a hierarchical structure emerges. For example, consider a car object. It may be composed of individual renderable components such as door objects, wheel objects, and a frame. When moving a car object in the scene from one location to another, we want all of its components to be moved in tandem. In that case it makes sense to organize them into a parent with multiple children structure , where door, wheel, and frame objects are all children of the car object. Now, when applying a translation to our car object, the transformation is propagated to all of its children. Sceneform’s Node provides us with the ability to organize objects into a scene graph hierarchy so that we can have the parent-child relationship between objects. Now, to render our graph of objects, we set ARCore’s Scene as a parent of our object graph. We can also enable and disable individual components by calling the setEnabled method on each Node object.

Conclusion
You can see how Sceneform greatly reduced the development overhead for our ARCore application. It abstracts the developer away from graphics APIs, provides a math library that helps with vector transformations, and composes the scene graph among other things. To see more of what Sceneform can do, check out the documentation on Google’s page.
 Denys Vorontsov is a Senior Software Engineer at Edmunds.com
